
I recently wrapped up one of the most challenging and rewarding projects I’ve been involved with: a 100-day engineering sprint led by Arrowhead Research, a non-profit dedicated to helping service members and veterans advance professionally through hands-on engineering projects, academic support, and publishing opportunities.
The project was called Black Relay, and it brought together dozens of volunteers from across industry and all four branches of the military, including active duty, reserve forces and veterans, to tackle a critical problem that first responders face in crisis situations.
The Problem Statement
The challenge we set out to solve was deceptively simple to state, but incredibly complex to execute:
How do you maintain situational awareness in an environment that doesn’t have any communications infrastructure to rely on?
Think about it. When a natural disaster strikes, when infrastructure is compromised, or when you’re operating in remote or hostile environments, you can’t rely on cell towers, internet connections, or traditional communication networks. Yet first responders, emergency coordinators, and tactical operators still need real-time intelligence to make informed decisions.
That’s where Black Relay comes in. Our mission was to create a common operating picture; a unified view of the operational environment using IoT sensors deployed at the edge, all without relying on traditional infrastructure. We needed to aggregate sensor data from edge devices, transmit it across a mesh network, and present it in a way that decision-makers could actually use when every second counts.
Team Structure
The project was architected around four core teams, each tackling a different piece of the puzzle. The beauty of this structure was that each team could work somewhat independently during the build phase, then integrate during the later phases of the project.
Pirate Radio
The Pirate Radio team was responsible for creating the edge network within our communication infrastructure: a mesh network using RF technology. This mesh network would enable data to travel from sensors deployed at the edge all the way back to decision makers in a command post, without relying on any existing infrastructure. These folks were dealing with radio frequencies, antenna configurations, and ensuring we had reliable connectivity even in challenging RF environments.
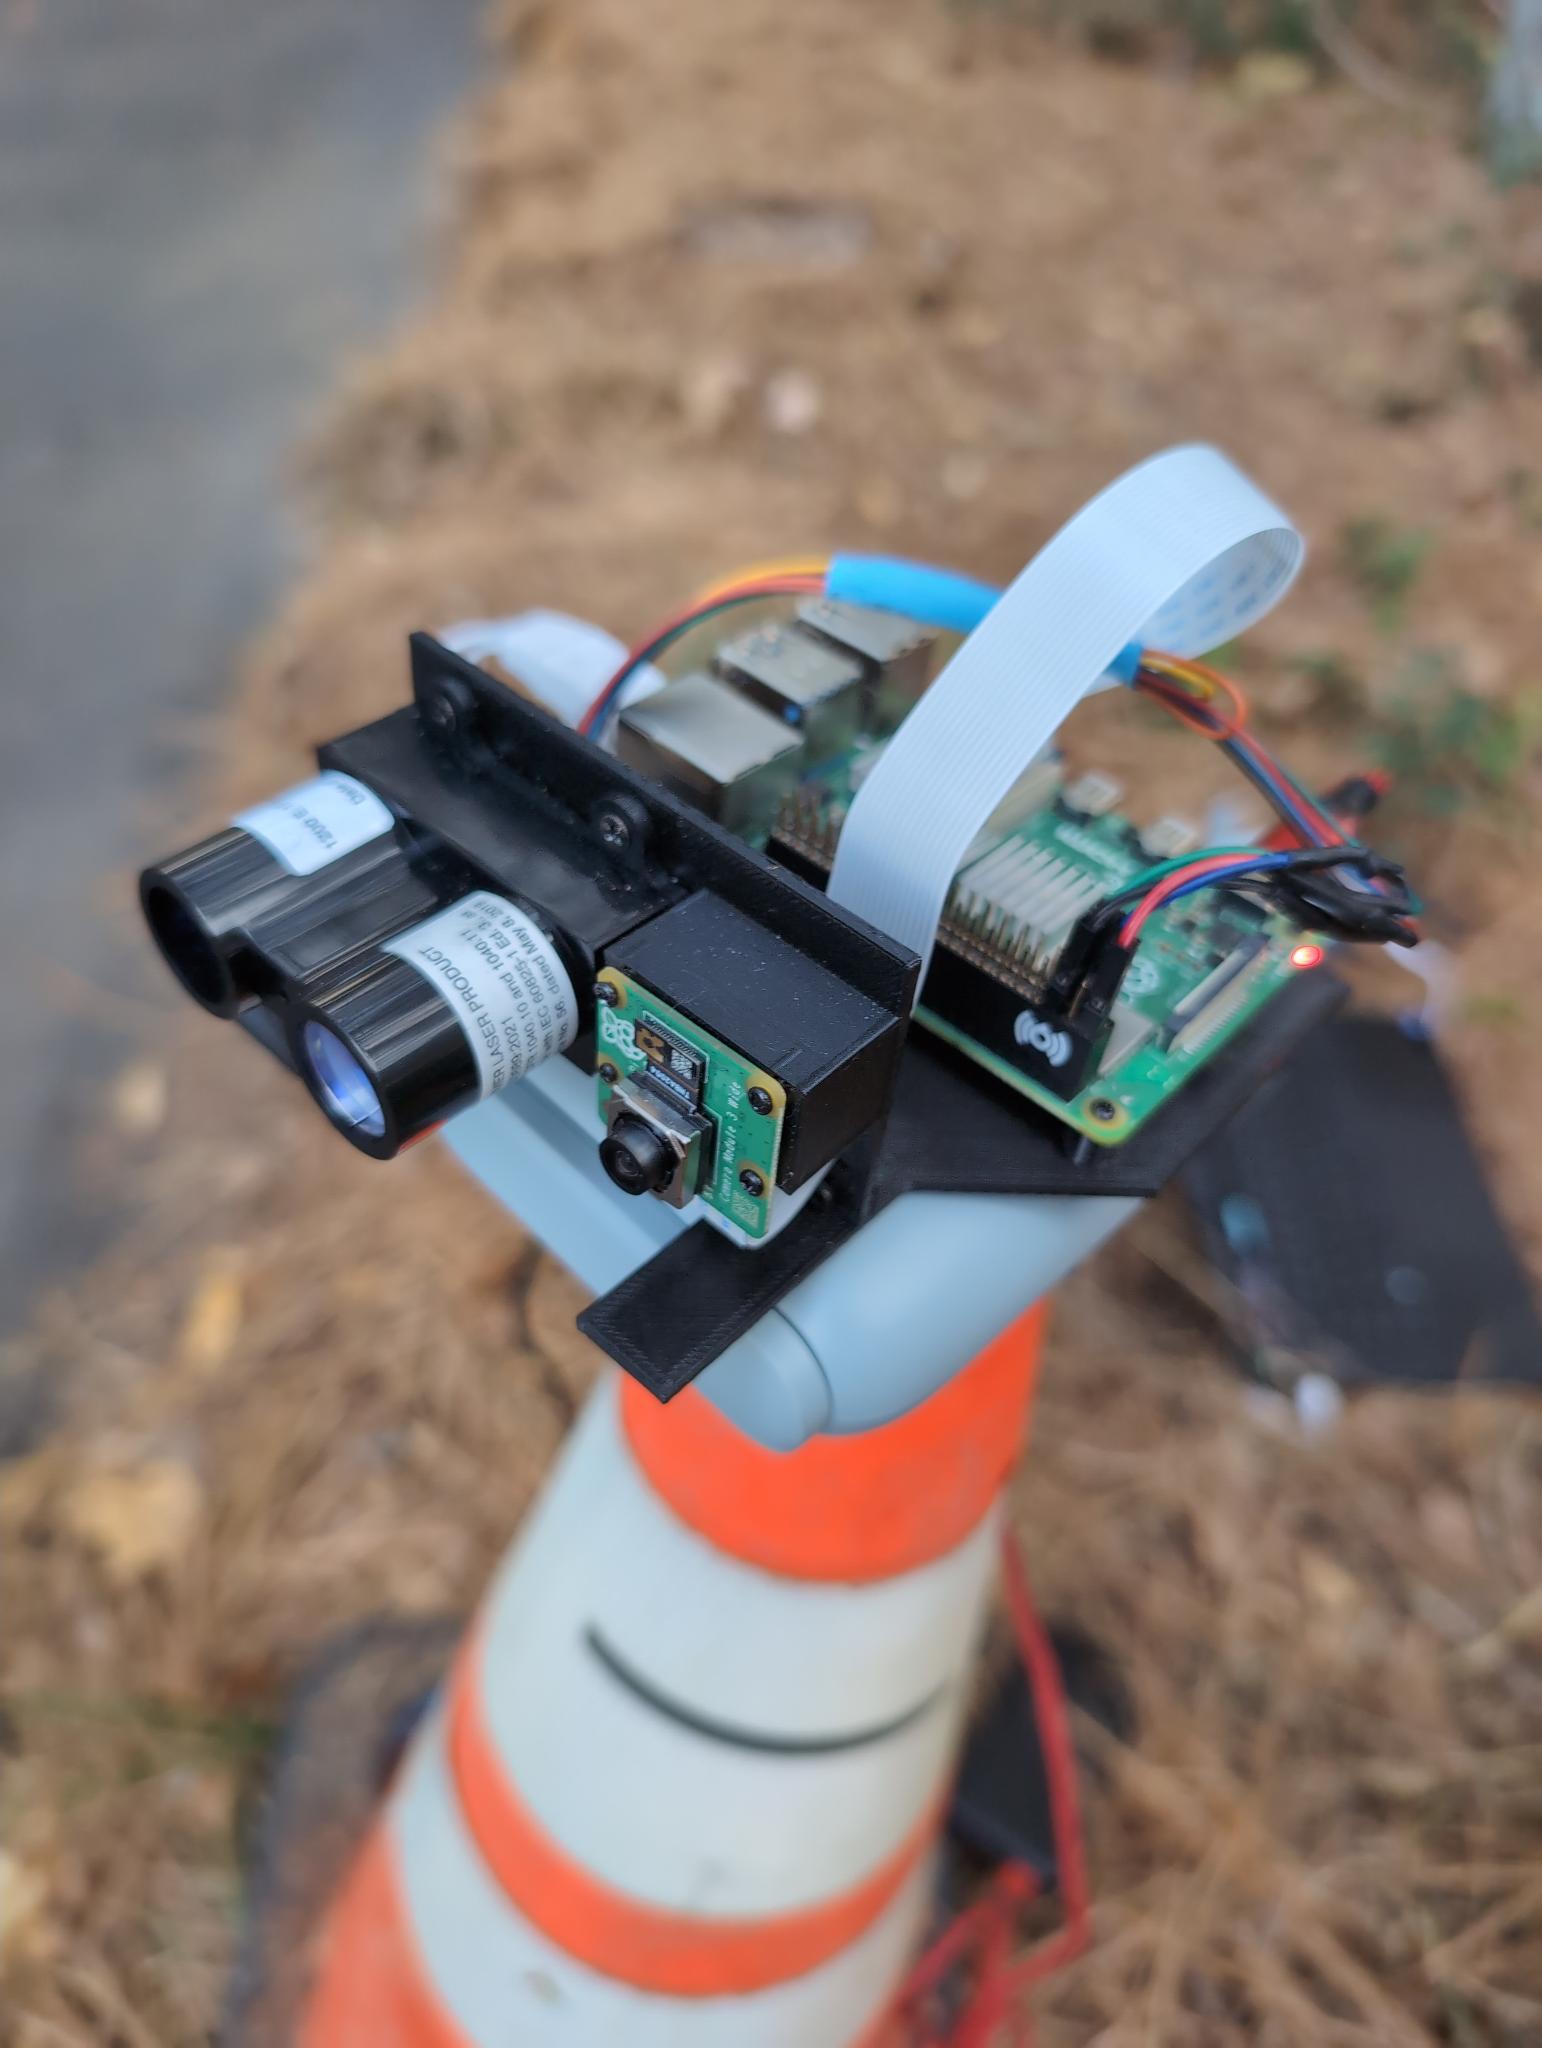
Edge Compute
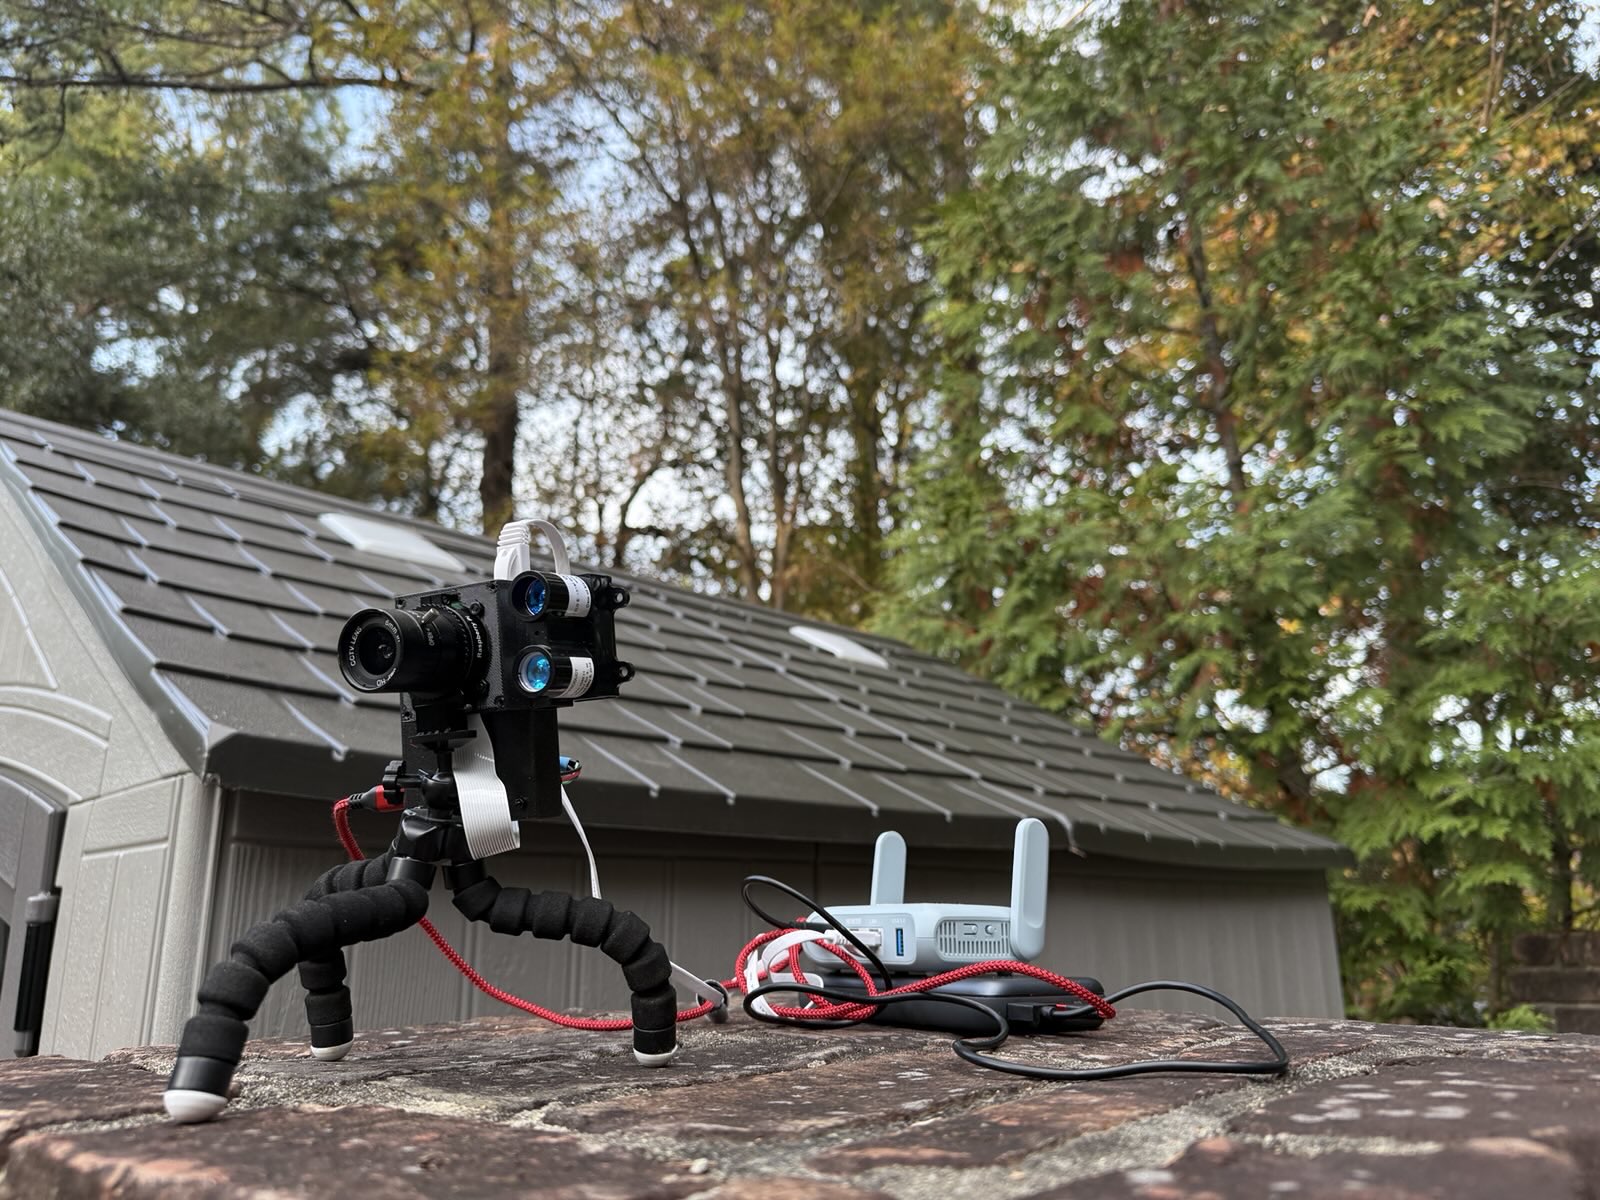
The Edge Compute team had the job of capturing intelligence at the source. They built custom sensors and integrated cameras to collect environmental data, everything from temperature and motion detection to air quality and proximity sensors. Their sensors needed to be rugged enough to deploy in field conditions and smart enough to format and transmit data reliably over the mesh network.
Infrastructure
This is one of the teams I was a part of. The Infrastructure team was responsible for building the “landing zone” for all of this data, as well as integrating cellular connectivity. We attempted to integrate srsRAN into the infrastructure to provide a private, 5G cellular network. However, we suspect that the RF hardware we procured (LimeSDR) underpowered and incapable of passing data properly.
After this discovery, the team’s primary focus became managing the server infrastructure and deployment pipeline for the web app. One of the team members, Robbie Litts, did a lot of the up front work testing our Proxmox setup and wrote some amazing documentation for it. We ended up hosting our services on Proxmox using a Minisforum MS-01 mini PC, a surprisingly powerful little machine that became the heart of our server infrastructure.
We virtualized an OPNsense router using Proxmox, which gave us complete control over our virtual machine networking. This allowed us to segment our network properly and ensure that the VMs hosting our application stack could communicate with both the mesh network and each other securely.
Web App
The Web App team built the user-facing component of the entire system: a full-stack web application that would serve as the “common operating picture” for operators. This is where I spent the other half of my time, specifically working on the backend.
The tech stack we chose was:
- Backend: Node.js with Express 5
- Database: MongoDB 8.2
- Message Broker: Eclipse Mosquitto (MQTT)
- Frontend: React 19 with TypeScript
- Infrastructure: Docker and Docker Compose
We knew early on that we wanted this app to be flexible with the data it took in. We wanted it to be capable of integrating with a wide range of sensor types that may be sending very different data payloads.
This led me to choose MongoDB as our backend database, because of it’s flexibility surrounding data schemas. But, rather than sending data directly to our API, I wanted an easier way for the edge compute team to integrate their sensors. For this, I chose MQTT because of it’s passive nature and publish/subscribe architecture.
The backend would listen for MQTT messages from specified topics, automatically persist that data to MongoDB, and categorize each event into one of four escalation levels: DETECT, ALERT, ALARM, or THREAT. The frontend would then query this data via a REST API and display it on an interactive map using Leaflet.js, giving operators a real-time geographic view of what was happening in the field.
The Three Phases
The project was broken up into three distinct phases, each with its own focus and challenges. Though, due to some logistical challenges, phases 1 and 2 kind of blended together, and phase 3 became more of what phase 2 was supposed to be.
Phase 1: Plan / Build / Test
During the first phase, which was meant to last about 60 days, we scoped out the entire project. We built architecture diagrams, decided on technologies, and ordered equipment. Once hardware arrived, each team got to work building their piece of the puzzle largely independently.
During this phase, I largely focused on my piece of the web app as we waited for equipment to get shipped. We had some logistical challenges with receiving equipment that significantly delayed any progress I could have made on the infrastructure side. Other teams were also largely in a planning phase until their equipment arrived.
The beauty of this phase was the autonomy. Each team could make decisions quickly without needing constant coordination. The downside, as we’d discover later, was that we made some assumptions about integration points that turned out to be problematic.
Phase 2: Stack Integration
Around day 60, we attempted to shift gears to stack integration. This was when the rubber met the road; where we would begin connecting the individual pieces of the puzzle that each team had built. This was a challenge because the volunteers lived all across the US and had varying degrees of day to day responsibilities outside of this project at their day jobs.
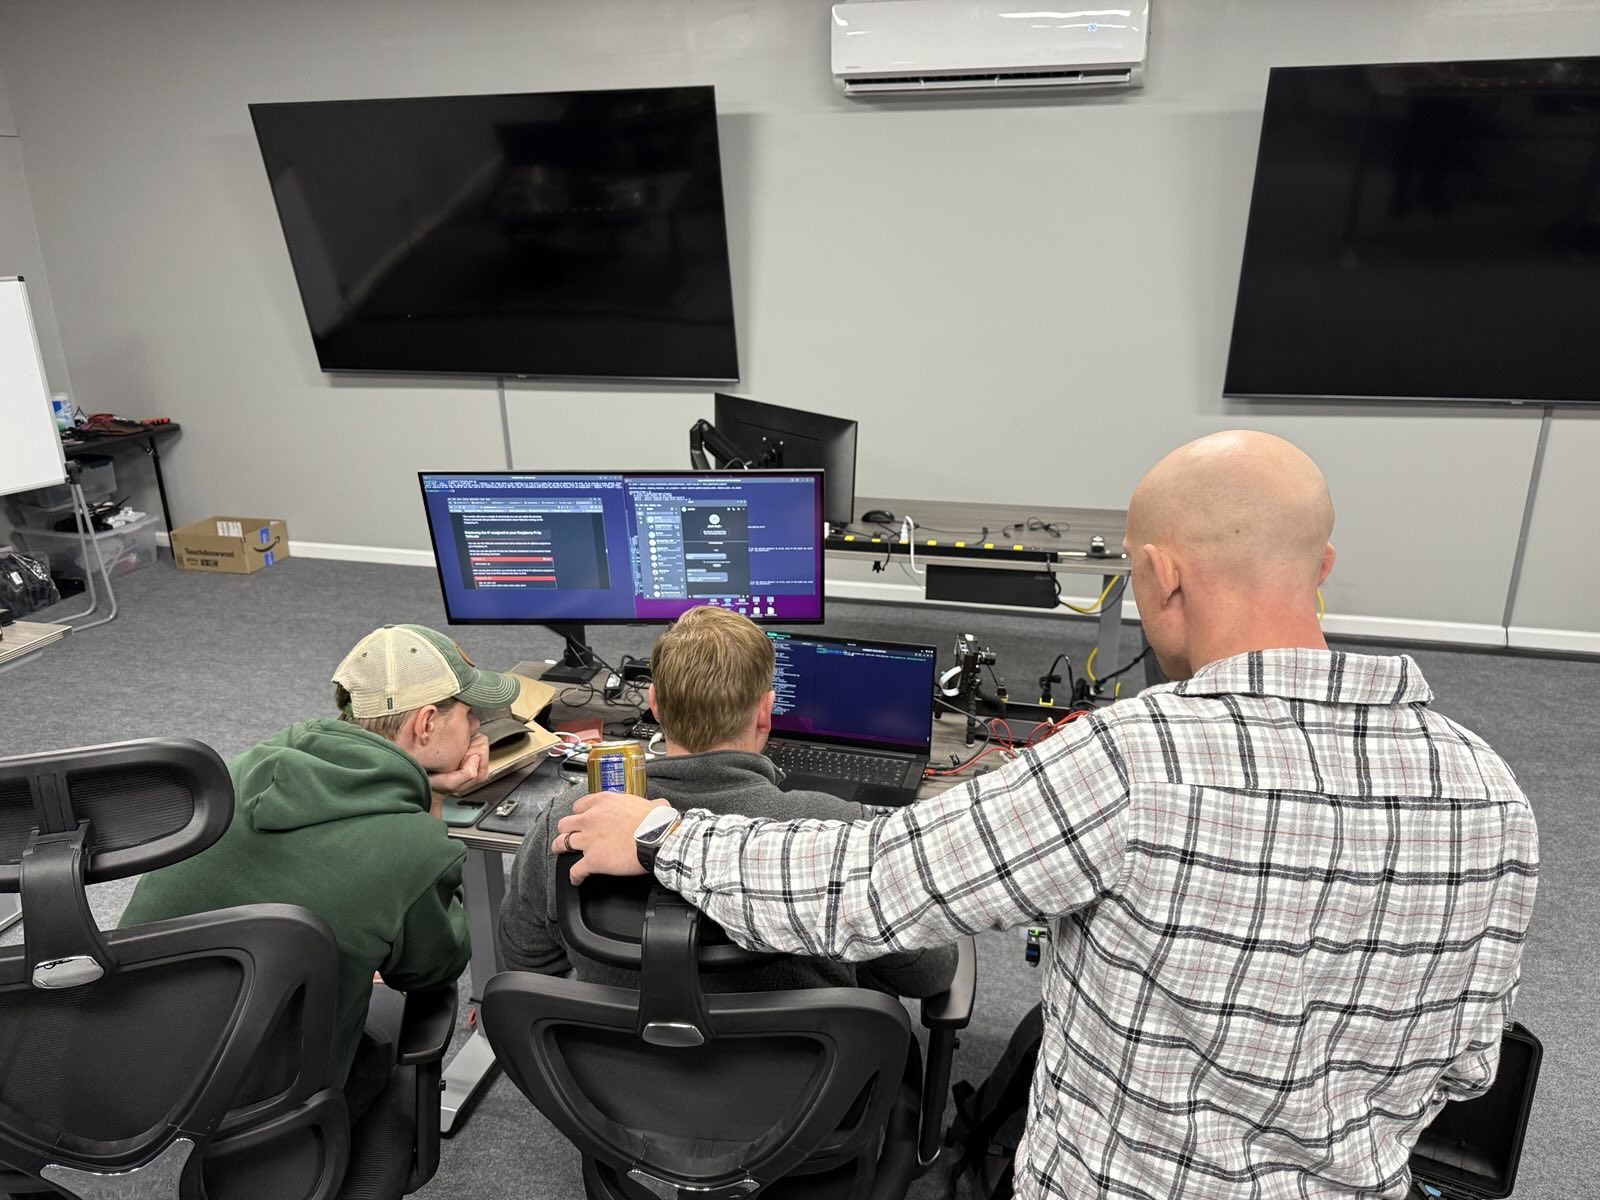
The edge compute team was able to conduct an in-person meetup during this phase to test data processing with local AI models. Unfortunately, we did not get to a full stack integration during this phase and it really ended up being an extension of phase I.
Phase 3: Final Testing
The final testing phase was conducted over a long weekend in Southern Pines, North Carolina. Operational Tech Solutions (OTS) graciously let us use their facility for the event. This was where everything came together, and where we discovered some critical architectural issues.
Extended Integration Testing
Going into the weekend, I think we all envisioned this as a “demo” where we’d showcase a working system to role players. The reality was quite different. We spent the first 24 hours doing intensive integration testing and smashing bugs that only surfaced when all components were running together in a real environment.
The Edge Compute team had sensors deployed around the OTS facility. Pirate Radio had their mesh network up and running. I had the Minisforum server on-site, and the Web App was deployed and accessible. But making it all work together was another story.
My Role
As I’ve already alluded to, I wore two hats during this project: DevOps engineer on the Infrastructure team and backend engineer on the Web App team. If I could do it again, I would definitely commit to a single role. Wearing both of these hats got very overwhelming at times and I think I could have done the overall project more justice if I was committed to a single role. Regardless, I’m happy I was able to provide value in both areas.
On the infrastructure side, I was responsible for the deployment pipeline of the web app. Originally, this was planned to be a Kubernetes-based deployment using a local GitOps pipeline. I wanted to deploy a local Gitea server and bootstrap a Talos linux VM against a repo using FluxCD. I even found a really awesome tool that could package everything for an air-gapped deployment, called Zarf, made by a company called Defense Unicorns.
Unfortunately, due to time constraints and competing requirements, this plan didn’t come to fruition. I’ll describe that in detail in a later section.
On the web app side, I architected and implemented the MQTT-to-MongoDB data flow, built out the REST API endpoints, implemented JWT-based authentication with role-based access control, and worked on ensuring our database schema could handle the flexible nature of sensor data. I’ll dive deep into that architecture in the next section.
The Technical Architecture: From Edge to Database
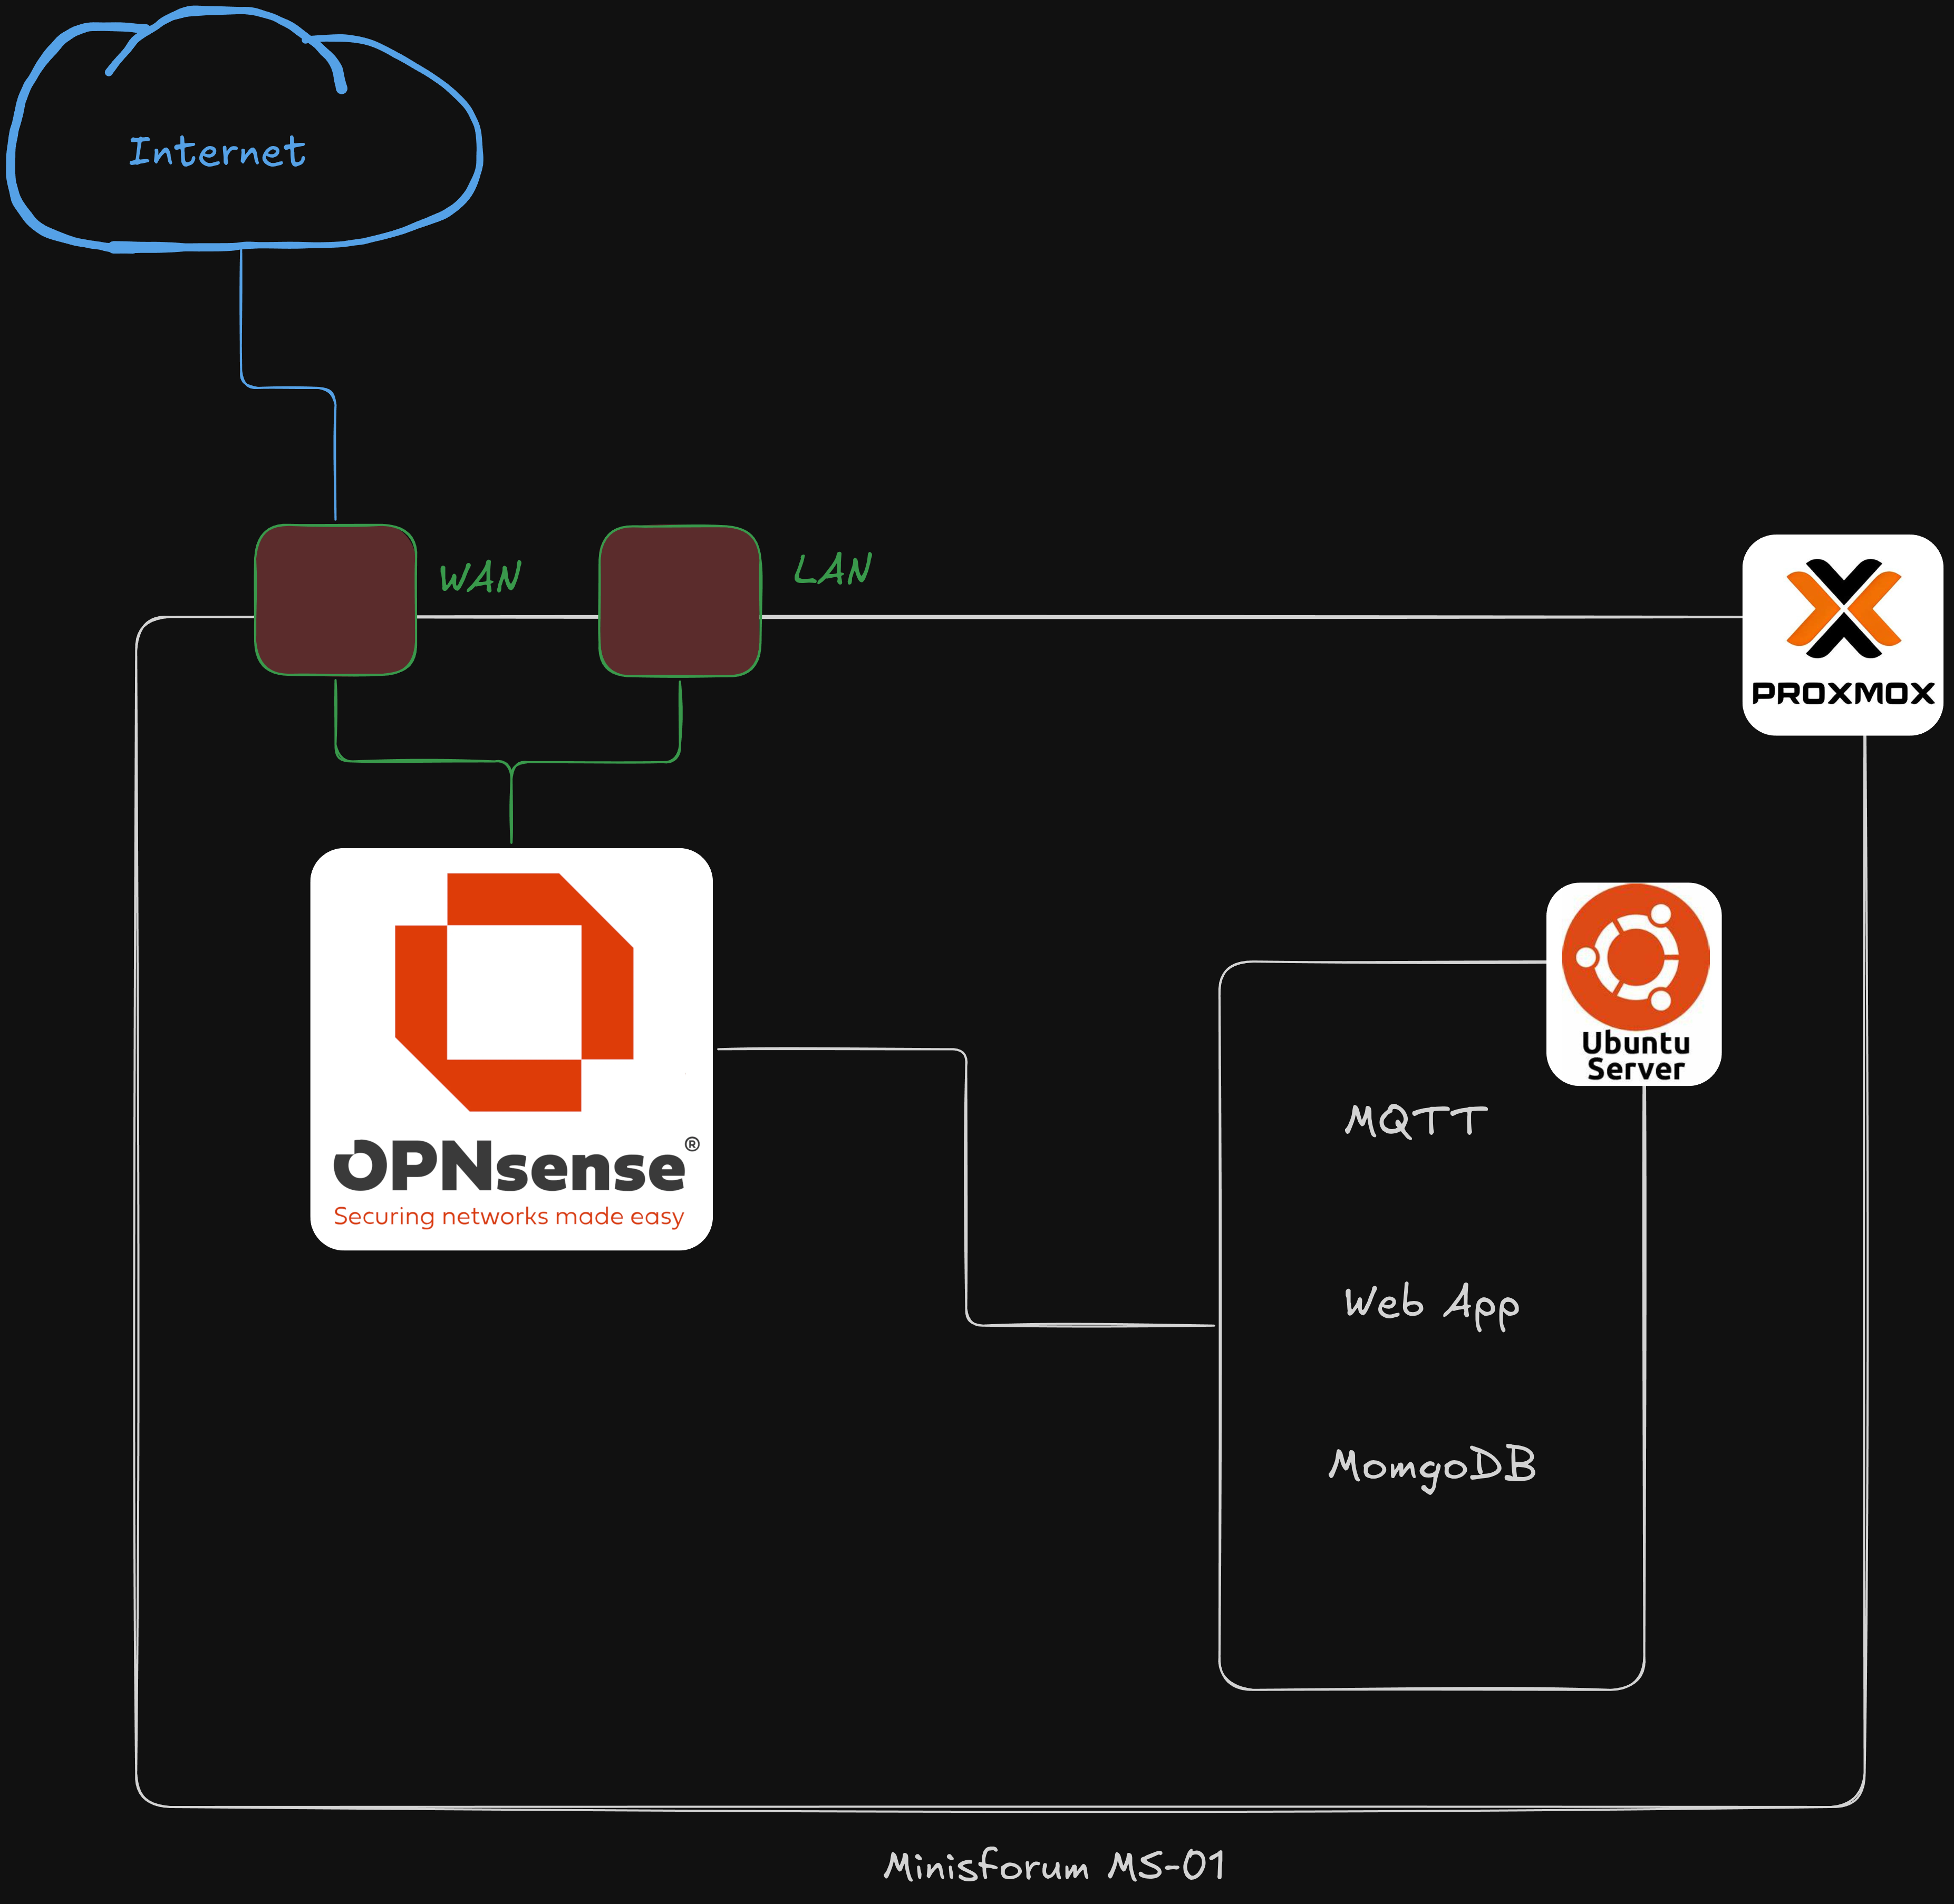
The following diagram was the original plan for the overall architecture, though it didn’t quite pan out this way.
I’ll go over everything that was different on gameday:

srsRAN
As you can see, this diagram shows how we planned to run srsRAN as a VM on the mini PC, enabling edge devices to communicate with hosted services (including the MQTT broker) over a private cellular connection. This was going to be the primary means by which devices talked throughout the system. Unfortunately, the SDR hardware we procured was incapable of passing the level of data that would be required for this system. In the future, this could be tested with a more powerful SDR platform. One of the infrastructure team members was able to successfully install it and provision a phone to the network, but was unable to pass any data.
Let me walk you through how data actually flowed through our system, from an edge sensor all the way to being stored in MongoDB and displayed on a map. This was the core of what made Black Relay work, and it’s where we learned some of our most valuable lessons.
Jump Box
One of our early ideas was to have the VMs on completely isolated networks, accessible only through the srsRAN network and a jumpbox for management. This concept also went away when we realized that srsRAN wasn’t going to work.
Instead, we decided to put the VMs on the OPNsense’s LAN network, segmented by VLANs. This would allow us to control access to servers over only the necessary ports and protocols. The only device that would connect to the physical LAN port on the Minisforum would be a management laptop. Access to services would be provided either via Tailscale, or through port forwarding on the WAN interface to a Caddy reverse proxy (more on that later).
Kubernetes and Gitea
Another major item that changed was the use of Kubernetes and a local Gitea server. Quite frankly, because I was dual hatting positions on two separate teams, I just wasn’t able to find the time to make this happen. Not to mention that we had some logistical delays in getting equipment delivered (I didn’t get the Minisforum delivered until the final two weeks of the project).
Instead, we opted for a simple Docker deployment. I wrote GitHub actions that would build the container images for frontend and backend on a push to the main branch and publish them to a GHCR registry. Then, it was a simple docker compose pull && docker compose up -d from the ubuntu server VM.
What we ended up with
Ultimately, what we ended up with looked a lot like this:
The Minisforum remained plugged in to the local network at our host’s facility on a standard internet connection, and edge devices communicated to it via Tailscale. Robbie built out a Headscale server on a VPS so that we weren’t reliant on Tailscale’s control servers. This was really fun to work with and it worked great to get devices to communicate over standard internet connections.
However, during final testing, we discovered that the edge devices weren’t able to authenticate with the Headscale server while they were out on Pirate Radio’s mesh network. This was either a bandwidth issue, or a DNS issue (possibly both). Unfortunately, we ran out of time to do a true root cause analysis.
Regardless, near the end of final testing, we realized that a better plan would have been to connect the PC directly to the Pirate Radio mesh, however we ran out of time to adequately test this. Rather than having the Minisforum’s WAN port connected to our host’s LAN network, we should have connected it to the gateway node on Pirate Radio’s mesh. Then, by properly port forwarding from OPNsense, devices on the mesh could have communicated directly with the web app, rather than needing to go over Tailscale.
The Data Flow
Now for the fun part. How does data actually get from an edge device to the web app? The data flow looked like this:
- Edge Device Publishes to MQTT
- Backend Subscribes and Listens
- Automatic Event Storage
- Frontend Queries via REST API
- Dashboard Displays with Geographic Context
Let’s break each of these steps down.
Step 1: Edge Device Publishes to MQTT
At the edge, our sensors were running on various hardware platforms, Raspberry Pis, custom sensor boards, cameras, all with one thing in common: they needed to publish their data to an MQTT broker. The way we ended up testing, these devices needed to be able to communicate over Tailscale. This proved to be a huge limitation and, ultimately we realized that the better route would be to have the MQTT broker hosted directly on the mesh.
Despite the networking limitations that we impose on ourselves, MQTT (Message Queuing Telemetry Transport) was the perfect protocol for this use case. It’s lightweight, designed for unreliable networks, and uses a publish-subscribe pattern that makes it easy to add new sensors without modifying the backend. Each sensor would publish JSON-formatted messages to a specific topic. For example:
{
  "sensorId": "temp_sensor_01",
  "latitude": 35.1799,
  "longitude": -79.4567,
  "timestamp": "2025-11-15T14:23:45Z",
  "temperature": 72.5,
  "humidity": 45.2
}
The topic structure was also designed to be flexible. Each sensor type published to its own topic, which allowed us to handle different sensor types with different data schemas.
Step 2: Backend Subscribes and Listens
Our Express backend acted as an MQTT subscriber. When calling the /topic/{topic}/subscribe endpoint, it would connect to the Mosquitto broker and subscribe to the requested topic. The code looked like this:
exports.subscribeToTopic = (req, res) => {

  const requestedTopic = req.params.topic

  topicsModel.findOne({ topicName: requestedTopic })
  .then(existingTopic => {
    if (existingTopic) {
      res.status(200).json({
        status: "success",
        message: `Already subscribed to topic ${requestedTopic}`
      })
    }
    else {
      topicsModel.create({ topicName: requestedTopic })
      .then(() => {
        mqtt_client.subscribe(requestedTopic, (err) => {
          if (err){
            console.error(err)
            res.status(400).json({
              status: "failed",
              message: `Could not subscribe to topic ${requestedTopic}`
            })
          }
          else{
            storeMessagesToMongo(requestedTopic)
            res.status(200).json({
                status: "success",
                message: `Successfully subscribed to topic ${requestedTopic}`
            })
          }
        })
      })
      .catch(err => {
        console.error(err)
        res.status(500).json({
          status: "failed",
          message: `Error creating entry in topics collection for ${requestedTopic}`
        })
      })
    }
  })
  .catch(err => {
    console.error(err)
    res.status(500).json({
      status: "failed",
      message: `Error checking existing subscriptions for topic ${requestedTopic}`
    })
  })
}
The above code is the controller called when calling the /topic/{topic}/subscribe endpoint. What’s happening here is we’re checking whether or not an entry in the topics collection has already been created for the requested topic. If it has, then we know that topic has already been subscribed to. If it hasn’t, we add a document to that collection and call the storeMessagesToMongo function. That code looks like this:
exports.storeMessagesToMongo = (requestedTopic) => {
  return mqtt_client.on("message", (topic, message) => {
    if(topic === requestedTopic){
      message = JSON.parse(message.toString())
      eventsModel.create({
        createdAt: new Date(),
        topic: requestedTopic,
        category: "DETECT",
        data: message
      })
      .then(eventDoc => eventDoc)
      .catch(err => console.error('Error while saving event document: ', err))
    }
  })
}
The key insight here is that every MQTT message automatically becomes an event in our database. We didn’t require any manual intervention or additional API calls. The backend was always listening, always ready to capture and persist new sensor data.
Resubscribing on a reboot
Now, if you have sharp attention to detail, you may have noticed something. To check whether or not we’ve subscribed to a topic, we’re only checking whether an entry exists in MongoDB or not. But we’re not actually doing anything with the MQTT client.
Well, early on when I was writing this code, I discovered that the MQTT client was ephemeral. On a reboot or a server crash, the client does not automatically come back to life and continue listening to its subscribed topics. You need to re-initialize a new MQTT client and have it re-subscribe.
Obviously I don’t want an end user to have to pay attention to the state of the backend server and remember to re-subscribe to their topics any time it reboots or crashes. So, I wrote some logic that forces the backend to re-initialize the MQTT client and re-subscribe to any topics for which a document in the topics collection already exists:
exports.reSubscribeToTopics = async (skippedCollections) => {
  if(!Array.isArray(skippedCollections)){
    console.error("Parameter provided to reSubscribeToTopics function must be an array.")
    return
  }

  try {
    const subscribedTopics = await topicsModel.distinct("topicName")
    subscribedTopics.forEach(topic => {
      if(!skippedCollections.includes(topic)){
        mqtt_client.subscribe(topic, err => {
          if (err) {
            console.error(`Error re-subscribing to topic ${topic}: `, err)
          }
          else {
            console.log(`Re-subscribed to topic ${topic}`)
            exports.storeMessagesToMongo(topic)
          }
        })
      }
    })
  }

  catch (error) {
    console.error('Error retrieving subscribed topics from MongoDB: ', error)
  }
}
The above function, reSubscribeToTopics is called in the main app.js file which is run when the server boots or initializes. It’s an asynchronous function that takes in a single parameter, skippedCollections, which allows me to provide an array of collections that the MQTT client can ignore (like users and rbac groups). Then, it calls the storeMessagesToMongo function described earlier for each relevant collection. This ensures that the backend server is always listening to the subscribed topics.
Step 3: Automatic Event Storage
Now that the backend is listening to any desired topics, it’s time to get some data.
When an MQTT message is received, a document is added to the events collection. The schema for this collection was designed to be flexible enough to handle different sensor types while still maintaining structure where we needed it.
Here’s what our Event schema looked like:
const eventSchema = new mongoose.Schema(
  {
    category: {
      type: String,
      enum: ["DETECT", "ALERT", "ALARM", "THREAT"],
      required: true,
    },
    topic: {
      type: String,
      required: true,
      ref: "Topic",
    },
    data: {}, // No schema defined, allowing for flexible data payloads
    acknowledged: {
      type: Boolean,
      default: false,
    },
  },
  {
    timestamps: true, // Automatically adds createdAt and updatedAt
  },
);
The data field is where the payload from the MQTT message is entered. An issue we ran into in the final integration phase was that we had sensors pushing empty messages. This would cause a document to be added to the events collection, but the data field would be empty.
I only recently discovered that by using mongoose.Schema.Types.Mixed, we could have made the field required while ensuring that only valid JSON objects were accepted. This would have given the same flexibility of the data payload, but also would have ensured JSON integrity and avoided empty messages.
Event Categorization
The escalation categories, DETECT, ALERT, ALARM, THREAT, were carefully thought out from a design perspective. The idea was this:
- DETECT: Any data event that came in (default category)
- ALERT: A predefined threshold (sensor-specific) determined by the edge compute sensor itself. For example, based on mission requirements, the edge compute team would configure a motion sensor to send an
ALERTrather than aDETECTif motion was detected between certain hours of the day. - ALARM: A device has been tampered with or lost connection
- THREAT: A manually elevated category determined by human input on the frontend. For example, an
ALARMcomes in on a particularly important sensor, and a battle captain determines that this constitutes aTHREATand manually raises the category.
By the end of integration, we really only had DETECT and THREAT working properly. All data that came into the system was categorized as a DETECT by default, and a user on the frontend could click an option to elevate that DETECT to a THREAT.
The plan for ALERTS was to work with the edge compute team to configure their sensors to call the backend API directly. They could send an MQTT message, and then call the API to update that entry in the database. This didn’t feel ideal, but I never came up with a better plan. Ultimately, we ran out of time to test this integration anyway.
ALARMs were trickier. We needed to somehow know if a device was being tampered with or losing connection. The best plan I could come up with was to have the edge devices push a regular healthcheck message to a topic called sensor_status. The frontend would monitor these healthchecks and, if a device missed too many healthchecks, it would flag it as offline. At this point, the next step would have been to update the corresponding entry in the database, but we didn’t have time to implement this logic before the conclusion of the project.
Step 4: Frontend Queries via REST API
With events stored in MongoDB, the frontend needed a way to retrieve them. I built a REST API with several endpoints to support different use cases. This is what the routes file looked like for events; it provides a good insight as to what the frontend had to work with to manipulate the data:
const express = require("express");
const router = express.Router();
const eventCtl = require("../controllers/event.js");

router.get("/", eventCtl.getAllEventData);

router.get("/id/:eventId", eventCtl.getEventDataById);

router.get("/topic/:topic", eventCtl.getEventDataByTopic);

router.get("/before", eventCtl.getEventDataBeforeTimestamp);

router.get("/after", eventCtl.getEventDataAfterTimestamp);

router.post("/", eventCtl.createNewEvent);

router.patch("/id/:eventId", eventCtl.updateEventById);

module.exports = router;
The events endpoints supported basic CRUD operations and allowed for retrieving events before and after certain timestamps, as well as filtering by topic. I planned to implement the ability to filter by event category as well but, unfortunately, this also never got done due to competing requirements and time constraints.
Authentication
I also implemented authentication using JWT tokens stored in httpOnly cookies. This prevented unauthorized access to the API and ensured that only authenticated users (admins and analysts) could view sensor data. I wrote this from scratch rather than using an authentication library, which was a great learning experience.
The auth controller would check whether the request contains a valid JWT, and ensure that the token is not expired. If these checks didn’t pass, it would use bcrypt to compare the plaintext password sent in the request body to the stored hash in the database for the requested user. If the comparison passed, it would issue a new JWT.
Then, to ensure that certain endpoints were protected by authentication, I created a helper function called authCheck that used the controller’s logic to validate credentials and added it as middleware to the endpoints. For example:
app.use('/event', authCheck, eventRoutes)
Step 5: Dashboard Displays with Geographic Context
The React frontend tied everything together. Using React-Leaflet and an OpenStreetMap tiling server, Fernando, our frontend dev, built an interactive map that displayed sensor locations and their most recent events. (This took some coordination with the edge compute team to ensure that each sensor sent a LAT and LONG in their data payload). The map would update in near-real-time as new events were stored in the database.
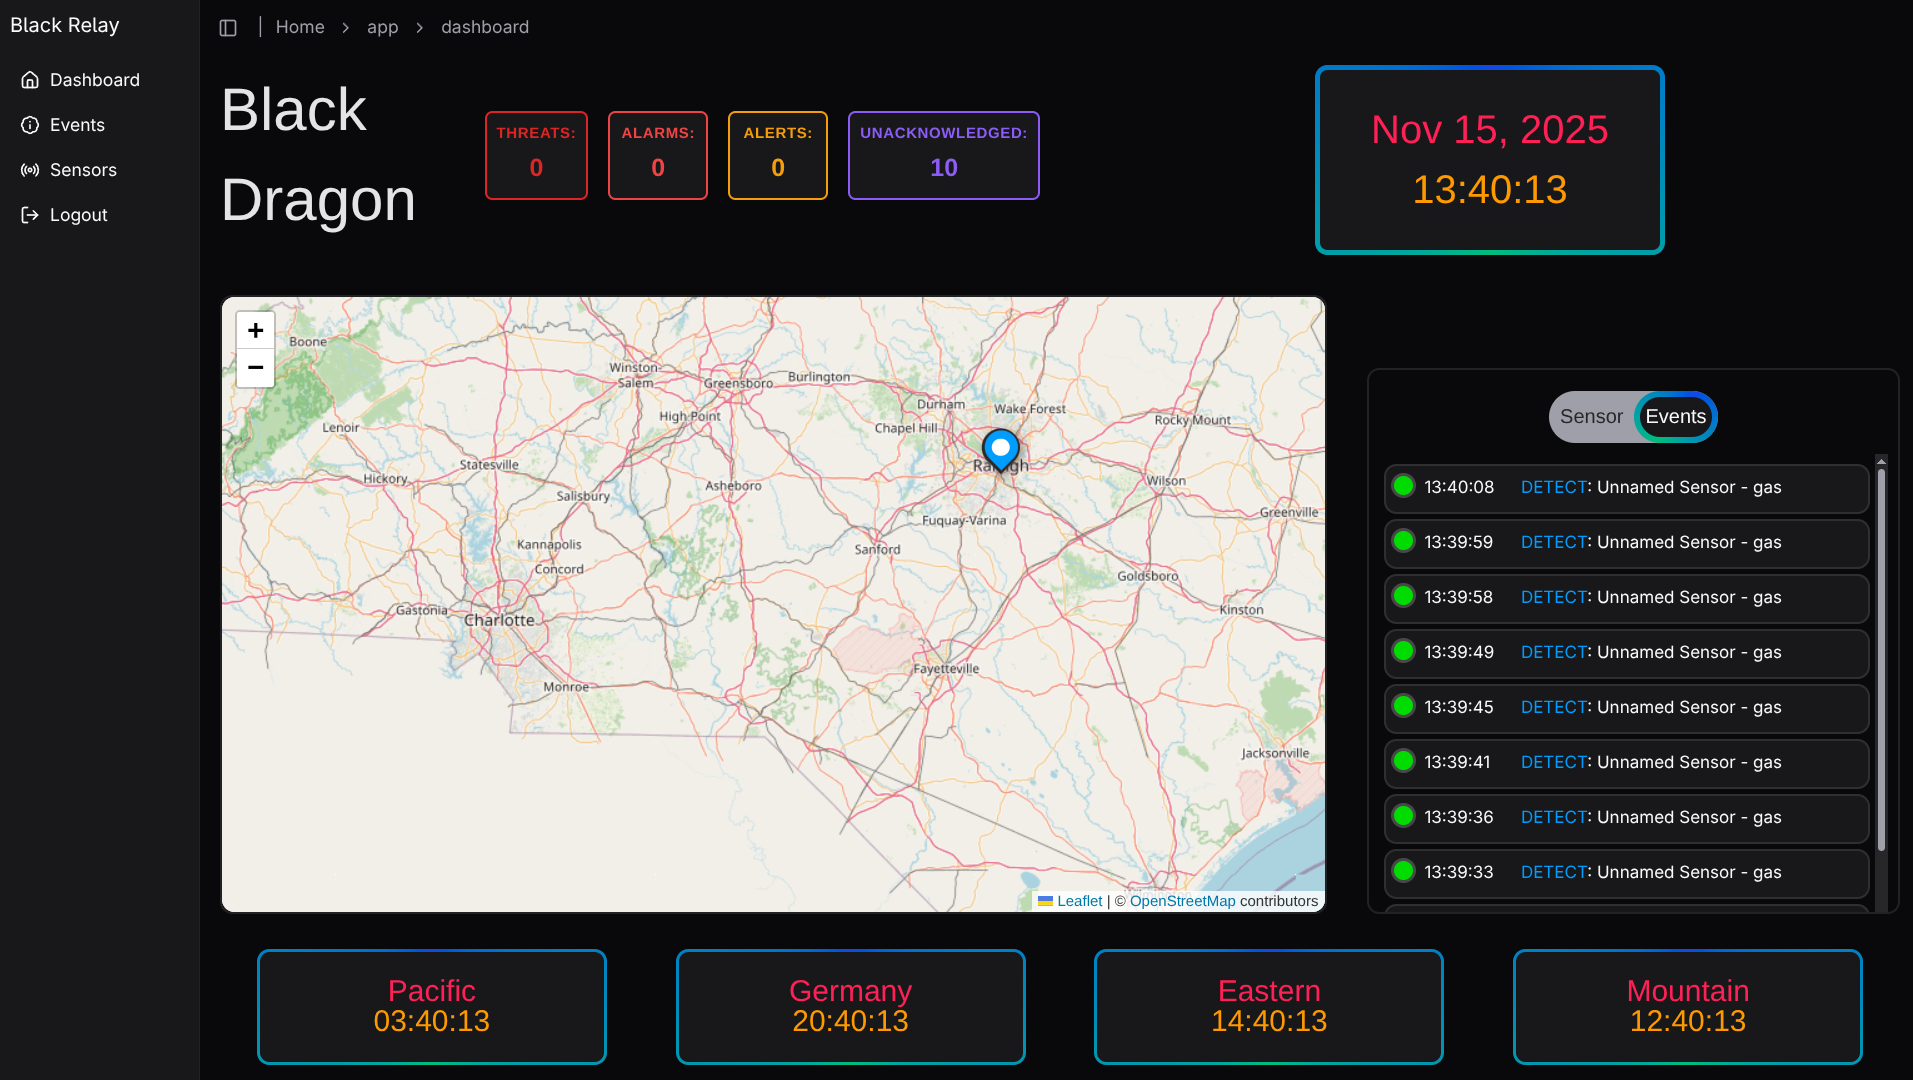
You’ll notice that the dashboard says “Black Dragon”…
Well, we were trying to come up with a cool name for the ‘operation’ we would be putting the role players through and this was the best we could come up while running on 4 hours of sleep and hundreds of milligrams of caffeine. Don’t judge.
Each event was displayed as a marker on the map, color-coded by its category.
Clicking on a marker would display the full event details, including the raw JSON payload from the sensor and options to acknowledge the event or export the data.
The Tailscale Lesson
As I’ve already alluded to, our biggest architectural issue only became apparent during this final phase: we had planned for edge devices to communicate with the Minisforum server over Tailscale, not realizing that if we hosted the server directly on the mesh network that Pirate Radio built, everything would be on the same LAN anyway.
This was a communication failure between teams. Infrastructure and Web App had designed our networking around Tailscale because we were testing remotely during the build phase. But Pirate Radio had always planned for everything to be local once we deployed. We essentially built a VPN solution to connect things that didn’t need to be remote in the first place.
The fix wasn’t complicated, we simply had the Minisforum server join the mesh network directly, but it highlighted the importance of architectural oversight across teams. Which brings me to our most important lesson learned.
Deployment Pipeline
As I alluded to earlier, the deployment pipeline ended up being much simpler than I originally hoped. I was hoping to experiment with a deployment to Kubernetes using GitOps, but we just ran out of time. What I built instead was this:
- On a push to the main branch, GitHub actions would build and push the frontend and backend container images to GHCR.
- From the server, I would run a simple bash script that would pull the latest image and re-run docker compose up.
Here’s what the GitHub action looked like
---
name: Build and Push Container Images

on:
  workflow_dispatch:
  pull_request:
    types: [closed]
    branches:
      - main
    paths:
      - ".github/workflows/*"
      - "app/**"
      - "api/**"

jobs:
  build-and-push:
    # Only run if the PR was merged (not just closed)
    if: github.event.pull_request.merged == true
    runs-on: ubuntu-latest
    permissions:
      contents: read
      packages: write

    strategy:
      matrix:
        include:
          - name: api
            context: ./api
            dockerfile: ./api/Dockerfile
            image: ghcr.io/black-relay/api
            target: runtime
          - name: app
            context: ./app
            dockerfile: ./app/Dockerfile
            image: ghcr.io/black-relay/app
            target: runtime
          - name: dummy-data
            context: ./api
            dockerfile: ./api/Dockerfile.dummy
            image: ghcr.io/black-relay/dummy-data
            target: runtime

    steps:
      - name: Checkout code
        uses: actions/checkout@v4

      - name: Set up Docker Buildx
        uses: docker/setup-buildx-action@v3

      - name: Log in to GitHub Container Registry
        uses: docker/login-action@v3
        with:
          registry: ghcr.io
          username: ${{ github.actor }}
          password: ${{ secrets.GITHUB_TOKEN }}

      - name: Extract metadata (tags, labels) for Docker
        id: meta
        uses: docker/metadata-action@v5
        with:
          images: ${{ matrix.image }}
          tags: |
            type=ref,event=branch
            type=ref,event=pr
            type=semver,pattern={{version}}
            type=semver,pattern={{major}}.{{minor}}
            type=sha,prefix={{branch}}-
            type=raw,value=latest,enable={{is_default_branch}}

      - name: Build and push Docker image
        uses: docker/build-push-action@v5
        with:
          context: ${{ matrix.context }}
          file: ${{ matrix.dockerfile }}
          target: ${{ matrix.target }}
          push: true
          tags: ${{ steps.meta.outputs.tags }}
          labels: ${{ steps.meta.outputs.labels }}
          cache-from: type=gha
          cache-to: type=gha,mode=max
          build-args: |
            VITE_API_URL=${{ vars.VITE_API_URL || 'http://localhost:3001' }}
            VITE_OSM_URL=${{ vars.VITE_OSM_URL || 'http://localhost:8080' }}

      - name: Generate image summary
        run: |
          echo "### ${{ matrix.name }} Image Built and Pushed 🚀" >> $GITHUB_STEP_SUMMARY
          echo "" >> $GITHUB_STEP_SUMMARY
          echo "**Image:** \`${{ matrix.image }}\`" >> $GITHUB_STEP_SUMMARY
          echo "**Tags:**" >> $GITHUB_STEP_SUMMARY
          echo '```' >> $GITHUB_STEP_SUMMARY
          echo "${{ steps.meta.outputs.tags }}" >> $GITHUB_STEP_SUMMARY
          echo '```' >> $GITHUB_STEP_SUMMARY
Admittedly, I used the help of copilot to write the initial draft. I figured this would be really simple workflow for it generate automagically for me, allowing me to make just a few tweaks.
What it spat out, however, caused me to learn quite a bit about GitHub actions, as it added some steps I wouldn’t have thought of. I’ll recap a few of them.
Matrix Strategy
Since we were building and pushing multiple container images, using a matrix strategy would allow for all three container builds to run concurrently. This was a great tool to learn and keep in my back pocket for another workflow down the road.
Building multiple image tags using docker metadata
I originally planned on having a single image tag: latest. This would just get overwritten with every push. I didn’t feel that we needed anything extra. However, copilot showed me that you can use the docker/metadata-action to extract data for use in tags like the PR number and git commit hash. This meant that there would be several tags for each build. Latest would still be the latest build, but if we needed to revert to a specific PR or commit, we could use that as a tag in the docker compose.
Although we didn’t end up making much use of this (we just pulled latest for the entire testing phase), I think it made the builds not only look more professional, but also be much more versatile for future use.
Avoiding a rebuild on every push
This one, I figured out on my own, without the help of our AI overlords. At times I found that we were only updating documentation or a line in docker compose, with no changes to application code, but the workflow would still build and push new container images. To prevent this, I learned that GitHub actions allows for specifying paths to look for changes in. If a change happens outside these paths, the workflow doesn’t run. This can be seen in the on.pull_request.paths section.
Overall Lessons Learned
If there’s one thing I could change about how we structured this project, it would be this: we needed a lead architect.
Not a team lead for any particular team, but someone who would sit above the teams with enough technical knowledge to identify integration issues early. This person’s job would be to ask the uncomfortable questions:
- “How exactly is Edge Compute planning to format their sensor data?”
- “What’s the handoff point between Pirate Radio’s mesh and Infrastructure’s network?”
- “Are we sure Frontend and Backend agree on the API contract?”
These questions need to be asked, and answered, in the first few weeks of a project like this, not during final integration testing.
Had we identified the data format early and standardized on a schema, Edge Compute could have started using it from day one. Had we clarified the network topology between teams earlier, we wouldn’t have built a Tailscale solution we didn’t need.
The other major lesson was the importance of standardized tooling for common tasks. Every edge device should have been running the same script to publish to MQTT. This would have eliminated an entire class of bugs and made the Edge Compute team’s life much easier.
The Outcome
Despite the challenges, Black Relay worked. During the final day of testing, role players walked through Southern Pines with our sensors deployed, and the system successfully captured, transmitted, and displayed their data in real-time. Operators at the command post could see motion detection events, temperature readings, and air quality measurements displayed on the map as they happened.
It wasn’t perfect. There were still bugs. There were sensors that stopped transmitting and needed resets. But the core concept was proven: you can create a common operating picture using IoT sensors and a mesh network, without relying on traditional infrastructure.
Photos

What’s Next
Black Relay as a project has concluded, but Arrowhead Research will host a similar engineering sprint next year. I’m incredibly grateful for the opportunity to work alongside such talented volunteers, and I’m already looking forward to the next challenge.
For those interested in the technical details, the entire Black Relay codebase is open source and available on GitHub. Feel free to poke around, submit issues, or even use it as a starting point for your own IoT intelligence platform.
Acknowledgments
This project wouldn’t have been possible without:
- Arrowhead Research - For organizing the sprint and creating opportunities for veterans and service members to build real-world skills
- Code Metal - For sponsoring the project
- Operational Tech Solutions - For hosting our final integration testing
- All the volunteers - From across industry and military, who donated their time and expertise to make Black Relay a reality